Browsing Tag

statistics

b15
Python,

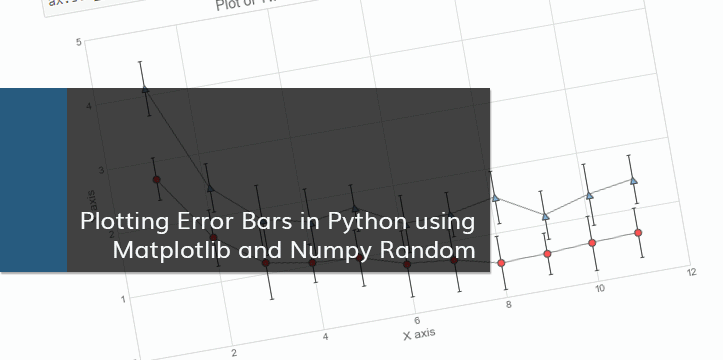
Plotting Error Bars in Python using Matplotlib and Numpy Random

A friend of mine needed help with plotting clusters with corresponding asymmetrical error bars. I decided to write a blog post about plotting error bars in Python after helping with the problem. The notebook can be also viewed on Github.

Error Bars

Error bars are graphical representations of the error or uncertainty in data, and they assist correct interpretation. For scientific purposes, reporting of errors is crucial in understanding the given data. Mostly error bars represent range and standard deviation of a dataset. They can help visualize how the data is spread around the mean value.

The Data

The data shown below is randomly generated for plotting purposes. This blog post is not about correct statistical interpretation of error bars, and solely written for demonstration purposes.

We will be using numpy for data generation. Let’s start by importing numpy.

In [1]:
# Importing numpy
import numpy as np
np.__version__
Out[1]:
'1.14.0'
feb_books
Books,

Reading – February 2018

This is a summary of non-Computer Science related books I’ve completed in February. As you may remember, at the beginning of this year I decided to increase my reading, with a goal of reading minimum 50 pages a day.

For February, I’ve read 1672 pages, with the average 60 pages/day, and completed 7 books. My best day was 113 pages, while my worst was about 20 pages during February.

For 2018, so far I’ve read 3615 pages, with the average 61 pages/day, and completed 15 books.


Previous post:

Reading – January 2018


Below is the list of books I’ve completed in February:

b11
Machine Learning, Python,

Statistical Terms in Data Science and Regression Metrics

Various statistical concepts are incorporated in Data Science. In this notebook I am going to cover some basic statistical terms, and talk about metrics used in Data Science for Regression tasks. This notebook can be also viewed on Github.

1. Statistical terms

Let’s look at some simple statistical terms in detail:

Mean (\bar{x} ): Averaging. Mean is a sum of all values divided by the number of values:

\bar{x} = \frac{\sum_{i=1}^{n}x_i}{n}

Variance (\sigma^2 ): Describes the spread of a distribution. For a set of values, the variance:

\sigma^2 = \frac{1}{n}\sum_{i=1}^{n}\big(x_i - \bar{x}\big)^2

Standard Deviation (\sigma ): Square root of variance, is in the units of the data it represents:

\sigma = \sqrt{\frac{1}{n}\sum_{i=1}^{n}\big(x_i - \bar{x}\big)^2}