Browsing Tag

inline

b15
Python,

Plotting Error Bars in Python using Matplotlib and Numpy Random

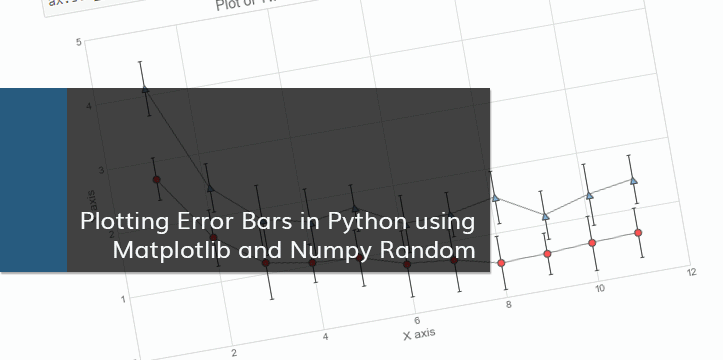
A friend of mine needed help with plotting clusters with corresponding asymmetrical error bars. I decided to write a blog post about plotting error bars in Python after helping with the problem. The notebook can be also viewed on Github.

Error Bars

Error bars are graphical representations of the error or uncertainty in data, and they assist correct interpretation. For scientific purposes, reporting of errors is crucial in understanding the given data. Mostly error bars represent range and standard deviation of a dataset. They can help visualize how the data is spread around the mean value.

The Data

The data shown below is randomly generated for plotting purposes. This blog post is not about correct statistical interpretation of error bars, and solely written for demonstration purposes.

We will be using numpy for data generation. Let’s start by importing numpy.

In [1]:
# Importing numpy
import numpy as np
np.__version__
Out[1]:
'1.14.0'
b14
Deep Learning, Python,

Basic Image Recognition with Built-in Models in Keras

In this blog post we are going to look at Image Recognition with built-in models available in Keras. The notebook can be also viewed on Github.

There are various pre-trained models available in Keras. The weights for these models are trained on a subset of ImageNet dataset. ImageNet is an image dataset containing millions of images with each image described in words. The models are trained on a dataset of 1000 types of common objects (the list of 1000 categories). This dataset is used during The ImageNet Large Scale Visual Recognition Challenge (ILSVRC).

The models for image classification available in Keras are listed below:

  • Xception
  • VGG16
  • VGG19
  • ResNet50
  • InceptionV3
  • InceptionResNetV2
  • MobileNet
  • DenseNet
  • NASNet

Once the model is instantiated, the weights are automatically downloaded to ~/.keras/models/ folder. We will be implementing ResNet50 (50 Layer Residual Network – further reading: Deep Residual Learning for Image Recognition) in the example below. The file containing weights for ResNet50 is about 100MB.

The versions

In this example I am using Keras v.2.1.4 and TensorFlow v.1.5.0 with GPU (using NVIDIA CUDA).


b8
Machine Learning, Python,

k-NN Nearest Neighbor Classifier

Nearest Neighbor Classification

k-Nearest Neighbors (k-NN) is one of the simplest machine learning algorithms. Predictions for the new data points are done by closest data points in the training data set. The algorithm compares the Euclidean distances from the point of interest to the other data points to determine which class it belongs to. We can define the k-amount of the closest data points for the algorithm calculations.

Lower k results in low bias / high variance. As k grows, the method becomes less flexible, and decision boundary close to linear. Higher k results in high bias / low variance.

Few links on the topic:

Also, this blog post is available as a jupyter notebook on GitHub.

b3
Python,

Data visualization with Python and Matplotlib – Part 2

In the previous chapter I described how to import the needed data to Pandas DataFrames, and how to manipulate DataFrame object. Now lets take a look on how we can visualize that data in a plot form. This is by no means a proper analysis of the suicide rates. It is a plotting example.
Below are the necessary imports. ‘%matplotlib inline’ is IPython-specific directive which displays matplotlib plots in notebook. It can be removed and plt.show() can be added to the end of the code to display the plot. We are also importing numpy, pandas, matplotlib.pyplot for plotting, and separately matplotlib to work on specific matplotlib functions if needed.

In [1]:
%matplotlib inline
import numpy as np
import pandas as pd
import matplotlib.pyplot as plt
import matplotlib as mpl

Next step is to import our data and assign it to DataFrame. We created that table in the previous example.

In [2]:
table = pd.read_excel('mergedData.xlsx')
table.head()
Out[2]:
Country 2015_s 2010_s 2015_p 2013_p 2010_p 2013_d suiAve suiPerDeath deaPerPop
0 Afghanistan 5.5 5.2 32526.6 30682.5 27962.2 7.7 5.35 0.694805 0.77
1 Albania 4.3 5.3 2896.7 2883.3 2901.9 9.4 4.80 0.510638 0.94
2 Algeria 3.1 3.4 39666.5 38186.1 36036.2 5.7 3.25 0.570175 0.57
3 Angola 20.5 20.7 25022.0 23448.2 21220.0 13.9 20.60 1.482014 1.39
4 Antigua and Barbuda 0.0 0.2 91.8 90.0 87.2 6.8 0.10 0.014706 0.68