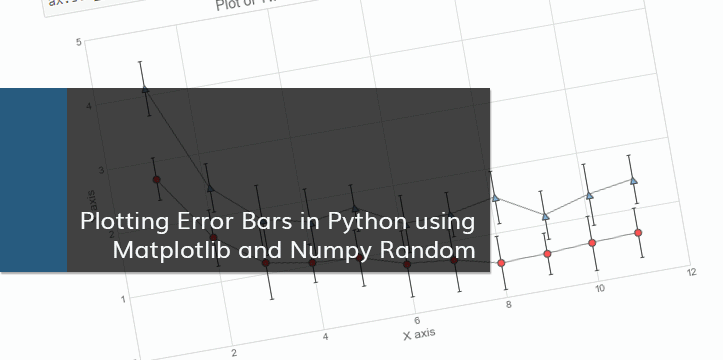
A friend of mine needed help with plotting clusters with corresponding asymmetrical error bars. I decided to write a blog post about plotting error bars in Python after helping with the problem. The notebook can be also viewed on Github.
Error Bars
Error bars are graphical representations of the error or uncertainty in data, and they assist correct interpretation. For scientific purposes, reporting of errors is crucial in understanding the given data. Mostly error bars represent range and standard deviation of a dataset. They can help visualize how the data is spread around the mean value.
The Data
The data shown below is randomly generated for plotting purposes. This blog post is not about correct statistical interpretation of error bars, and solely written for demonstration purposes.
We will be using numpy for data generation. Let’s start by importing numpy.
# Importing numpy
import numpy as np
np.__version__
