World Health Organization provides a wide range of data available for download in different formats.
The data is accessible through their website: http://www.who.int/gho/en/
In this example we will be working with Pandas DataFrame to organize the data. As an example I am going to work on suicide rates throughout the world.
import pandas as pd
By using ‘read_csv’ function, suicide crude rates (per 100,000 people) data is assigned to pandas object.
suicideData = pd.read_csv('SuicBoth.csv')
suicideData.head()
Total population (in thousands).
populData = pd.read_csv('Population.csv')
populData.head()
Now that we have two pandas objects, we can start merging the data together by the countries. We are using ‘inner’ method, the intersection of keys from both frames, while preserving the order of the left keys.
mergedData = pd.merge(suicideData, populData, on=['Country'], how='inner')
mergedData.head()
I separately downloaded the population data from 2010.
populData2010 = pd.read_csv('Population2010.csv')
populData2010.head()
mergedData = pd.merge(mergedData, populData2010, on=['Country'], how='inner')
mergedData.head()
Overall death rate (per thousand people).
deathData = pd.read_csv('DeathRates.csv')
deathData.head()
mergedData = pd.merge(mergedData, deathData, on=['Country'], how='inner')
mergedData.head()
Now that we have all the tables merged, we can clear the columns that we are not going to use, and rename the other column headers.
del mergedData['Sex'], mergedData['2005'], mergedData['2000'], mergedData['Year']
mergedData = mergedData.rename(columns={'2015_x':'2015_s','2010':'2010_s','2005':'2005_s',
                                        '2000':'2000_s','2015_y':'2015_p','2013_x':'2013_p',
                                        'Population (in thousands) total':'2010_p','2013_y':'2013_d'})
mergedData.head()
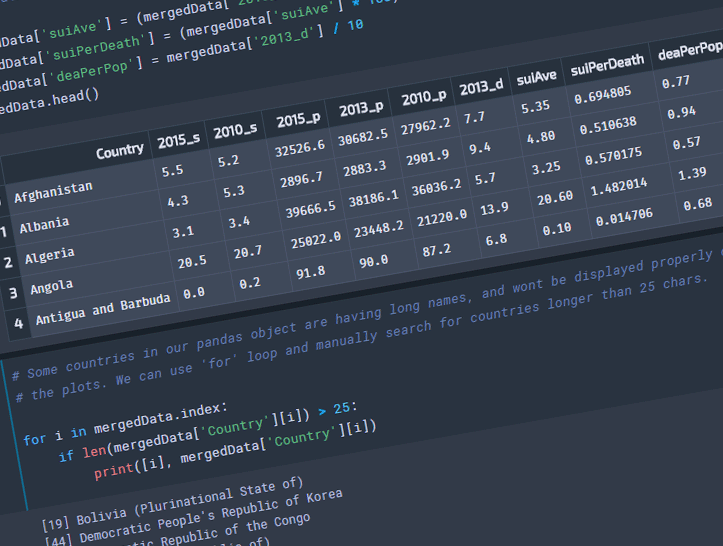
We will need to do some calculations prior working on the plots. The death rates data is for 2013, but the suicide rates data for that year is not available. ‘suiAve’ is an average in between 2010 and 2015 data. ‘suiPerDeath’ is the percentage of the suicides from the total death count. ‘deaPerPop’ is the percentage of death to the total population.
mergedData['suiAve'] = (mergedData['2010_s'] + mergedData['2015_s']) / 2
mergedData['suiPerDeath'] = (mergedData['suiAve'] * 100) / (mergedData['2013_d'] * 100)
mergedData['deaPerPop'] = mergedData['2013_d'] / 10
mergedData.head()
Some countries in our pandas object are having long names, and wont be displayed properly on the plots. We can use ‘for’ loop and manually search for countries longer than 25 chars.
for i in mergedData.index:
    if len(mergedData['Country'][i]) > 25:
        print([i], mergedData['Country'][i])
Or we can do it through pandas DataFrame.loc function.
mergedData['Country'].loc[((mergedData['Country'].str.len()) > 25)]
Once the data is sorted, we can manually replace the needed cells.
mergedData.loc[19, 'Country'] = 'Bolivia'
mergedData.loc[44, 'Country'] = 'North Korea'
mergedData.loc[45, 'Country'] = 'DR Congo'
mergedData.loc[76, 'Country'] = 'Iran'
mergedData.loc[89, 'Country'] = 'Laos'
mergedData.loc[106, 'Country'] = 'Micronesia'
mergedData.loc[136, 'Country'] = 'St. Vincent and Gren.'
mergedData.loc[161, 'Country'] = 'FYR Macedonia'
mergedData.loc[172, 'Country'] = 'UK'
mergedData.loc[173, 'Country'] = 'Tanzania'
mergedData.loc[178, 'Country'] = 'Venezuela'
The data then can be exported to the format of interest (in this case as Excel file), for further processing, and plotting.
from pandas import ExcelWriter

writer = ExcelWriter('mergedData.xlsx')
mergedData.to_excel(writer,'mergedData')
writer.save()
Downloadable content:
Population.csv
Population2010.csv
DeathRates.csv
SuicBoth.csv
mergedData.xlsx