One of the purposes of this blog, as it is stated in the About page, is to share useful information while I am practicing to code. I think it is also a good habit to have posts like this one to refresh my own memory. Data comes in many forms (including CSV – Comma-separated values), and it needs to be imported for further manipulations and analyses.
Let’s assume, in the same working directory as our project, we have a csv file (Population.csv) with population info per each country for the years 2013 and 2015 (Data taken from WHO website):
Country,2015,2013
Afghanistan,32526.6,30682.5
Albania,2896.7,2883.3
Algeria,39666.5,38186.1
Andorra,70.5,75.9
Angola,25022,23448.2
. . .
import csv
We can use Python’s standard library CSV to do the import:
import csv

fileCSV = open('Population.csv', 'rt')
data = csv.reader(fileCSV)

for row in data:
    print(row)
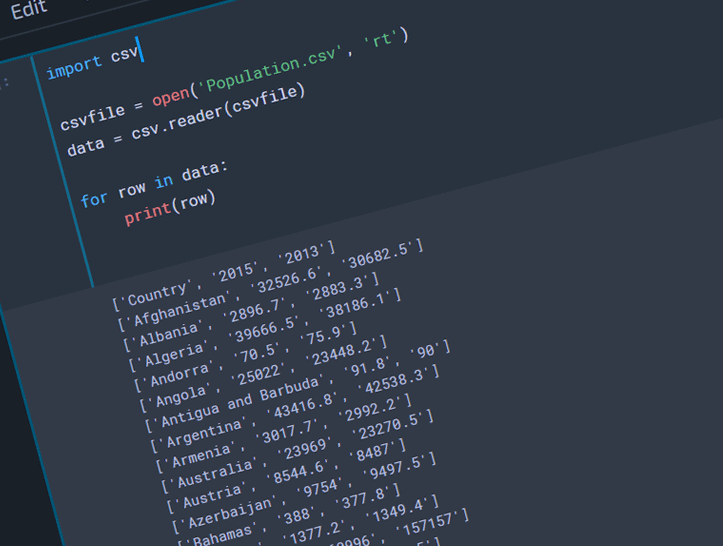
CSV library is first imported, then ‘Population.csv’ is opened to the variable ‘fileCSV’. We read the file to another variable ‘data’ using csv.reader function. Now we can use the for loop to print every row in our ‘data’ variable, which outputs as below:
['Country', '2015', '2013']
['Afghanistan', '32526.6', '30682.5']
['Albania', '2896.7', '2883.3']
['Algeria', '39666.5', '38186.1']
['Andorra', '70.5', '75.9']
['Angola', '25022', '23448.2']
. . .
read_csv
Another way is to use Pandas to import the csv file directly to DataFrame for future editing purposes:
import pandas as pd
populData = pd.read_csv('Population.csv')
populData.head()
Pandas is generally imported under alias pd. The function read_csv is used to gather the data to the variable populData. We can check the data by using .head() which returns first 5 rows of the data.
| Country | 2015 | 2013 | |
| 0 | Afghanistan | 32526.6 | 30682.5 |
| 1 | Albania | 2896.7 | 2883.3 |
| 2 | Algeria | 39666.5 | 38186.1 |
| 3 | Andorra | 70.5 | 75.9 |
| 4 | Angola | 25022.0 | 23448.2 |


